 |
FAQs
Q1. I installed tcptrace on sunos together with tcpdump and libpcap and made a few tests, however I am very puzzled by the lack of traffic in the reverse direction!
Q2. I have been trying to find out when you place a diamond and when an arrow and why.
Q3. XPLOT will only zoom out as far as the original plot. I cannot figure out what is happening at the handshake and closing of a connection.
Q4. Do you know if I'd be able to find precompiled versions of tcpdump or a similar package for Windows platforms from somewhere?
Q5. I've just tried tcptrace. It seems to be really good. But, I've got a problem: I can't trace any UDP packets. It's like we can only decode TCP packets. Is it a tcptrace feature?
Q6. Tcpdump program seems to degrade the performance. If the use of the tcpdump degrades performance then how else can someone use your tcptrace program in Free BSD?
Q7. And a last question: In case of TPUT which line should I consider? I suspect it should be the blue one.
Q8. How do I print the plots from xplot?
Q9. I just installed tcptrace and xplot, but I'm having trouble figuring out how to load the neat plots into xplot? Any chance of including a typical session in the docs?
Q10. xplot doesn't work
Q11. Do programs such as snoop identify the application (e.g. telnet, ftp) simply by knowledge of the standard port numbers, or is there something else in the packet somewhere that identifies it?
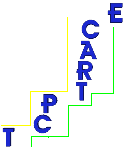
Q12. [...referring to the TSG graphs...] interpretation of some of the graphics, like the "3" and diamonds and arrows and such.
Q13. From the code, there are a bunch of types of ACKS and things. A bunch of different colors as well.
Q14. Is there any way to always use the same set of flags?
Q15. It seems to be running VERY slowly, and using very little CPU time
Q16. with "-t", why is the percentage done more than 100%
Q17. What are "post-loss acks"?
Q18. Re. Valid RTT Sample.
Q19. What does this mean in the long output with RTT stats: "For the following 5 RTT statistics, only ACKs for multiply-transmitted segments (ambiguous ACKs) were considered. Times are taken from the last instance of a segment."
Q20. Is it possible to use it for monitoring the whole traffic between two hosts (from and to all ports) in one throughput graph?
Q21. I get the message indicating that there is the presence of hardware duplicates. What exactly does that mean?
Q22. I just have a question regarding the congestion window plot.
Q23. Can I use the program in "real-time" mode?
Q24. Somebody pointed out that there's now a windows port of tcpdump.
Q25. What does the "truncated data" and "truncated packets" mean ?? I ask this because I do not see any anomalies using our sniffer and tcpdump, but this field has us confused.
Q26. I was wondering if you could please explain what the following actually mean in the detailed output: data xmit time: 1.377 secs
Q27. Is there a version of tcpdump for wintel machines?
Q28. I get some 'Z' letters printed out by xplot on a sequence number graph, and I couldn't find anything about this in the doc I found. Do you know what they mean ?
Q29. I actually wanted very selective outputs.
Q30. What's with all of the stupid quotes for module args
Q31. Not being completely sure how to interpret out of order packets, I would be grateful if you could confirm that such conditions occur following packet losses
Q32. What if I want the output file names to be different or to go in a different place?
Q33. What is a valid input file format for tcptrace? And which programs (besides tcpdump) can produce dump files which tcptrace understands?
Q34. tcptrace does not support Dags native output format.
Q35. What is the last option that is specified in the SYNC packet ([|tcp]),
Q36. I am aware that TCPTrace only takes BINARY dump files from TCPDump. However, I have a lot of useful ASCII formatted TCPDump files which I wouldn't mind analyzing with TCPTrace.
Q37. xplot generates the following error message: "XAllocColorCells failed, will only have one plot color"
Q38. The only difference in my problem (and the one above), is that I have started getting this message since yesterday,, Before that xplot could plot all the colors.
Q39. tcptrace generates the following error : "Resource temporarily unavailable"
Q40. can tcptrace trace UDP "connections" ?
Q41. Meaning of the white crosses on the green line (which tracks the acknowledged data by the receiver) of TIME-SEQUENCE graphes. Are they "non containing data segments"?
Q42. I am using ns2.1b6 and want to generate trace files to be analyzed with tcptrace. Until now I have only be able to generate ASCII traces in ns, but tcptrace use binary traces.
Q43. Re. Superimposing xplot file.
Q44. I'd like to remove the arrows in time sequence graph (tsg). What must I do?
Q45. I can see a lot of HD (Hardware duplicate) but I don't understand what it means.
Q46. What's the meaning of the yellow line in time sequence graph? Is it the advertise window at receiver? If yes, how can I measure it if on the Y axis there are the packet number sequence?
Q47. I am interested in measuring the throughput of my client-server application i.e. port to port throughput ability.
Q48. Do I need to install anything else for tcptrace?
Q49. Does tcptrace work with Windows?
Q50. Can I convert the .xpl files generated by xplot into gnuplot format?
Q51. Why do I get the error "Fatal, too many hosts to name (max length 8)", when I run tcptrace on my dump file?
Q52. I have difficulties analyzing trace files generated by ns2 with tcptrace.
Q53. How is the throughput in the throughput graph measured ? Does it include payload + tcp/ip header or just the pure payload ?
Q54. How can I calculate the delay and delay variation (jitter) with tcptrace output? What about the "idletime max", how is this figure calculated?
Q55. Does tcptrace distinguish between ACKs and Delayed ACKs while calculating RTT samples?